Galen Barbose & Naïm Darghouth, Lawrence Berkeley National Laboratory January 15, 2018
Lawrence Berkeley National Laboratory recently announced the 10th annual edition of their Tracking the Sun report. This year’s report summarizes installed price trends for residential and non-residential photovoltaic (PV) systems installed in the United States through year-end 2016, with additional data for the first half of 2017. It is a companion to Berkeley Lab’s other annual solar market data report, Utility-Scale Solar, which focuses on the utility-scale sector and was recently released in its latest edition.
Tracking the Sun draws from a dataset maintained by Berkeley Lab, consisting of more than 1.1 million PV systems (a subset of which is ultimately analyzed within this report). Key findings from this year’s report include the following:
• Installed Prices Continued to Decline through 2016 and into 2017.
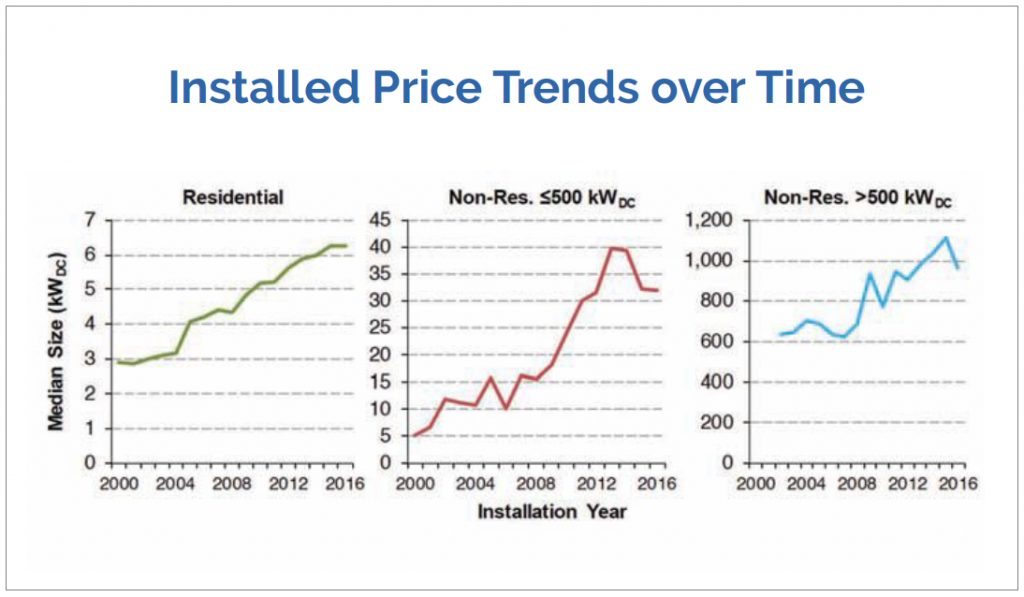
National median installed prices in 2016 fell year-over-year by 2% to 8%, depending on customer segment. These were the smallest annual declines in recent years. However, data for the fi rst half of 2017 suggest that installed prices for the current year are on pace to fall by at least 10% for each customer segment, similar to long-term average rates of decline.

• Recent Installed Price Reductions Have Been Driven by Declining Hardware Costs.
Over the long-term, both hardware and non-hardware (i.e., soft) costs have fallen substantially, contributing in almost equal measure to the decline in residential installed prices. More recently, however, hardware costs have been the dominant driver. In fact, the aggregate drop in module, inverter, and racking prices over the 2015 to 2016 period exceeded the observed decline in total system level installed prices over the same span. That apparent disconnect reflects a natural lag between changes in component prices and system prices, and is consistent with the larger installed-price decline observed in the first half of 2017.
• Installed Prices Vary Widely Across Individual Projects.
Among residential systems installed in 2016, 20% were priced below $3.2 per watt (W)-the 20th percentile value- while 20% were above the 80th percentile at $5.0/W. Non-residential systems exhibit similar spreads, albeit shifted downward. The potential causes for this variability are numerous, including differences in project characteristics, installers, and local market or regulatory conditions. These wide pricing distributions serve to demonstrate the potential for low-cost installations. For example, more than 15,000 residential systems installed in 2016 (9%) were priced below $2.5/W, and 8,000 (5%) were below $2.0/W.
The latest edition of Tracking the Sun, along with an accompanying summary slide deck and data file, can be downloaded at trackingthesun.lbl.gov. A public version of the underlying dataset used in the report can be downloaded through the National Renewable Energy Laboratory’s Open PV website, openpv.nrel.gov.


