


By Dave Erb April 10, 2026
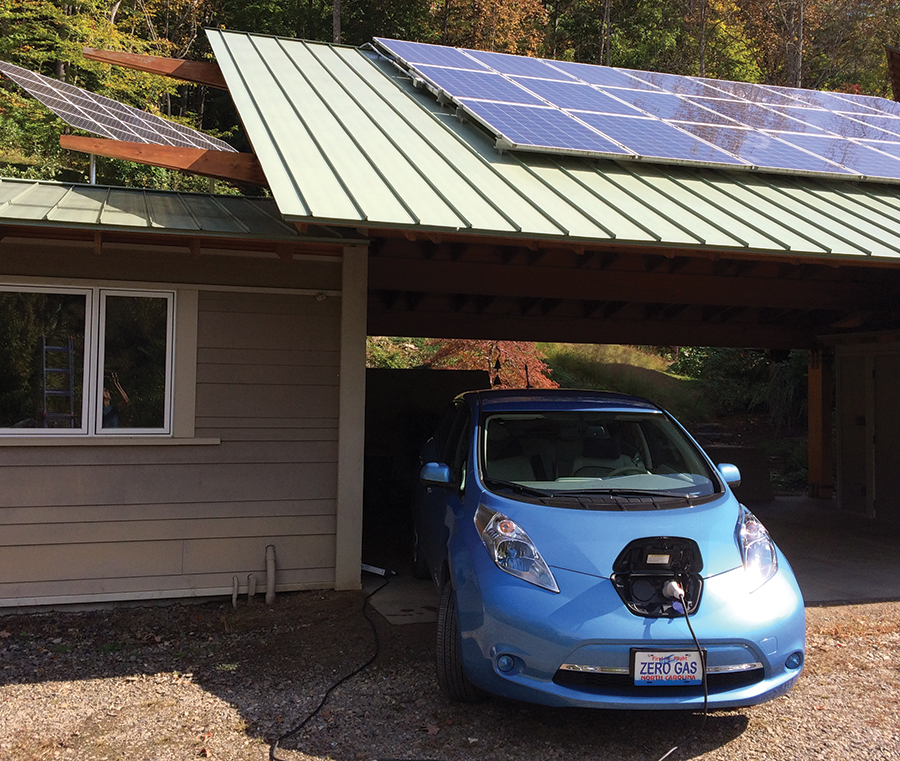
Nissan Leaf charging on sunshine. © Joe Baum, Blue Ridge EV Club
Fossil fuels brought us modern life. Coal jumpstarted the industrial revolution. More recently, oil and gas greatly advanced mobility and revolutionized agriculture. But today, fossil fuels are at the center of wars, major environmental damage, income inequality, and a host of other ills. It’s way past time to retire them. We can start the process with three data points and one simple calculation.
Think Globally, Act Personally
Fossil fuel interests exert inordinate control over the world’s economies and politics, so much of the transition will fall to individuals. Transportation, representing 27% of U.S. energy consumption, with roughly half of that going to light duty vehicles,1 offers some of the lowest hanging fruit. Four steps can help propel us forward:
- Reduce demand for motorized travel, by replacing some motion with forethought. Examples would include telecommuting, trip consolidation, or moving closer to one’s workplace.
- Use vehicles more productively, by better matching vehicle size to payload size. Downsizing to a smaller vehicle is one way to accomplish this, carpooling is another.
- Electrify vehicle powertrains, to the maximum extent allowed by the vehicles’ use cases.
- Generate electricity renewably.
It’s important to rebut the mistaken argument that we shouldn’t buy electric vehicles (EVs, step 3) before we fully green the grid (step 4). In fact, each step represents immediate progress, today, even if taken in isolation. For details, see the Union of Concerned Scientists’ excellent analysis.2 However, to the extent that there might be a correct order, it’s as shown. Conservation enables technology. Steps 1 and 2 are pure conservation steps. Step 3, vehicle electrification, incorporates both technology and significant conservation. Step 4 is purely technological.
None of these actions require permission. Neither OPEC, nor the president, nor anyone else has veto power. The only barrier for many people is sufficient confidence in their ability to approach steps 3 and 4 wisely.
The Difference Between Energy and Power
Though often conflated, energy and power are two distinct things. Energy is the ability to do work. Engineers and scientists have a very specific, mathematical definition of work, but it’s irrelevant here. Suffice it to say that, if doing something manually could cause you to sweat, there’s work involved.
Power is the rate at which energy is transferred or, stated another way, the speed at which work is done. If we think of energy as a substance, like water, then power is the flow rate, how fast we’re pumping the water.
Work and energy have dimensions of force times distance: Newton-meters (Nm) in SI units. To distinguish energy from torque, we call a Nm of energy a Joule (J). Power is the amount of energy transferred divided by the time it took to transfer it, Joules per second (J/s), which we call watts (W).
We distinguish size ranges using prefixes. A typical cell phone charger transfers electrical energy at a rate of about 5 W. A kilowatt (kW) is 1000 W; a lawnmower, running at full throttle, does work at a rate of about 3 kW (4 horsepower). A megawatt (MW) is 1000 kW; a railroad locomotive, running at full throttle, does work at about 3 MW. A gigawatt (GW) is 1000 MW; a modern nuclear reactor generates electricity at about 1 GW.
Since power is energy divided by time, energy is power multiplied by time: one Joule is equal to one watt-second. Measuring electrical energy is hard, but measuring electrical power is fairly easy, so utilities measure power (kW), multiply by the time the power was drawn (hours, h), add it all up at the end of the month, and bill customers for energy in kilowatt-hours (kWh). Depending on the size of the numbers, we might also express energy in watt-hours (Wh).
What does the Difference Make? (PV Edition)
People buy photovoltaic (PV) systems to produce energy (kWh). They are often sized in terms of power (W, kW). For comparison’s sake, it can be useful to think about the price of PV systems in $/watt. PV output varies with the sun’s brightness. Panels are rated by their electrical output under “peak” sun, defined as 1000 watts of light power per square meter. Actual light input depends on location, weather, and time of day and year. Additionally PV panel orientation, comprising tilt (angle above the horizontal) and azimuth (compass direction the panel faces), is also important. Some panels are on fixed mounts, others on trackers which vary the orientation to follow the sun.
Considering these factors, the amount of sunshine that hits the panel during a given time period can be expressed in “peak sun hours,” the number of hours of full noontime sun that would result in the same amount of light hitting the panel.
The National Laboratory of the Rockies (formerly NREL) has compiled extensive data on the solar resource across the United States, and programmed them into a calculator incorporating panel type and orientation to provide a month-by-month estimate of PV output in any given location. This calculator, called PVWatts, is online, and quite intuitive to use.3
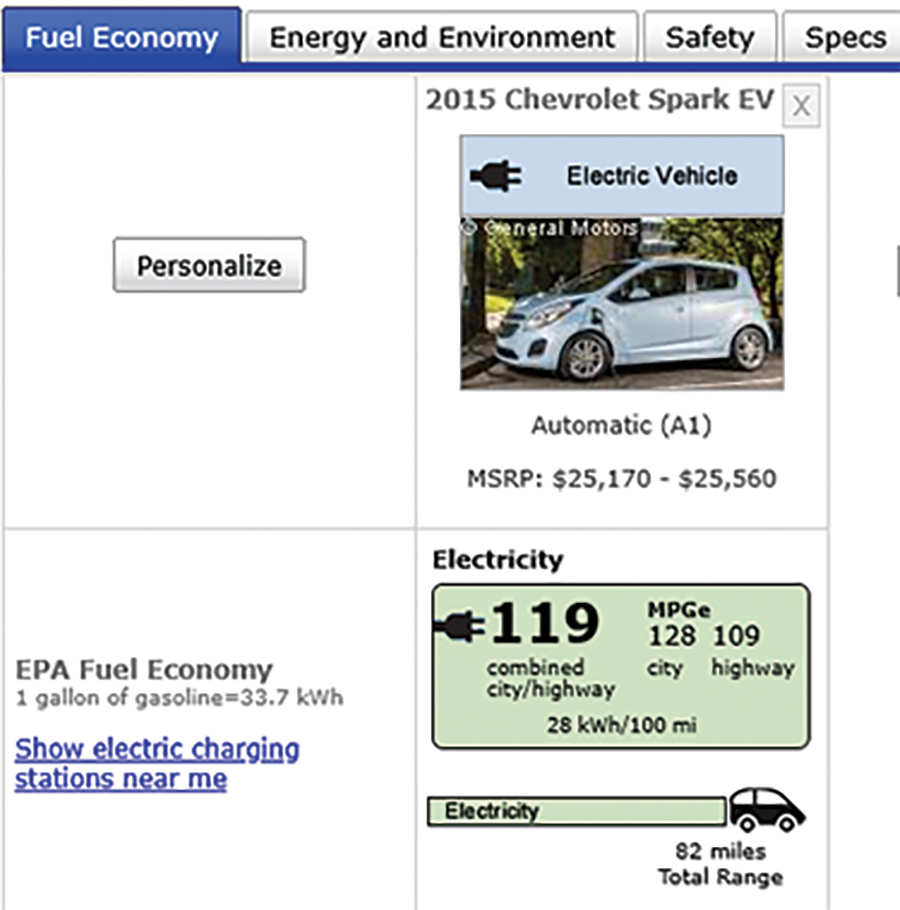
2015 Chevy Spark EV listing from fueleconomy.gov. © Oak Ridge National Laboratory
To estimate peak sun hours, the PVWatts user can input data for a one kW system. The resulting energy output in kWh is numerically equal to the number of full sun hours for that location.
What Difference does the Difference Make? (EV Edition)
The power of an EV’s motor (or an internal combustion vehicle’s engine) directly impacts its dynamic performance: acceleration, top speed, gradability (the combination of speed and slope the vehicle can maintain while climbing), and towing capacity. When charging, the electrical power input (usually stated in kW) and the vehicle’s energy intensity (measured for our purposes in Wh/mile) combine to determine charging speed, the miles of range replenished for each hour spent charging.
Energy intensity can be found on the Environmental Protection Agency (EPA) fuel economy website.4 However, EPA’s numbers require some massage. Mileage values for the Combined, City, and Highway cycles of the standard fuel economy test are shown in “equivalent miles per gallon.” MPGe relates all energy consumption, regardless of fuel, to the amount of energy in standard unleaded gasoline, 33.7 kWh per gallon. To turn mileage in MPGe into the corresponding energy intensity in Wh/mi, divide it into 33,700. Conversely, we can turn energy intensity in Wh/mi into MPGe by dividing it into 33,700.
EPA also provides Combined cycle energy intensity numbers in kWh/100 miles. To convert these into Wh/mi, simply multiply by 10. Combined cycle energy intensity for 2025-26 EVs lies between 230 Wh/mi (146 MPGe) and 720 Wh/mi (47 MPGe). Unlike combustion vehicles, City cycle consumption is lower than Highway for EVs. Coupled with the energy intensity, battery energy capacity (typically expressed in kWh) determines range, the distance the vehicle can travel on a charge.
The Final Countdown
Finding the PV capacity needed to charge the EV requires three data points: vehicle energy intensity (Wh/mi), annual vehicle miles traveled, and annual full sun hours at the site. Multiply energy intensity by vehicle miles traveled, then divide by full sun hours to get the amount of PV required (in W).
Using 1,400 full sun hours per year (the ten year average measured at my family’s home in Asheville, NC), 185 Wh/mi (the five year average for our Chevy Spark EV), and 6,000 mi/yr (our typical usage of the Spark), we see that the Spark consumed the output of 793 W, 13 percent of our 6 kW PV system.
Though these are real world numbers, this result is anomalously low, shown here to illustrate the danger of relying on anecdotal data. My wife and I are experienced EV drivers; our driving style tends to maximize range. Asheville is a very compact town, which minimizes the total miles traveled and maximizes the city portion of those miles. And the Spark was one of two EVs in our garage; the other one took the road trips.
EPA rates the Spark EV at 280 Wh/mi (119 MPGe) on the Combined cycle. The average American drives about 15,000 mi/yr. Using these numbers, the Spark would require the output of 3,000 W of PV, half of our 6 kW system. Driving style and distance traveled both matter. EV owners who already know their actual consumption can use that number in the calculation. The best approach for everyone else is to use the EPA Combined cycle number, because the EPA test is highly repeatable, and the Combined cycle is the best estimate of “average” U.S. driving. But nobody is actually average; we’re all above or below average. If you have a heavy right foot, or if you’d like to build a little cushion into your calculation, using the EPA Highway figure will provide a more conservative estimate.
Why Not Put the PV on the EV?
As the owner of two cars with license plates that misspell “solar car,” I get frequent pushback about the lack of solar panels on either. My panels are on the roof of my house, where they’re always properly oriented and never shaded; and on the grid, where there’s always a useful place for their output to go, even when the batteries are full. They add no weight or aerodynamic drag to the cars, and are unaffected by the brutal shock and vibration cars endure. They’re precisely where they belong.
Though permanently mounting PV
on an EV is unlikely to make sense, changes to net metering protocols, driven by fossil fuel shills in state legislatures, may change the cost equation enough to make an off-grid combination of PV and EV attractive. Declining hardware costs have already made EVs an effective source of backup power. Whether with auto manufacturer-approved systems or with simple homebrewed inverter setups, several of my neighbors put their EVs to useful (indeed, lifesaving) service during 2024’s Hurricane Helene. We’ll see a lot more of this V2L (vehicle-to-load) activity in the future. But that’s a topic for another article.
Low Hanging Fruit
Driving on sunshine is cleaner, quieter, and more pleasant than burning dead dinosaurs. It can save a lot of cash and insulate drivers from inflation. It keeps money in the community, and out of the hands of petrostate despots. And it’s ripe for the picking.
About the Author
Automotive engineer and ASES Life Member Dave Erb has developed vehicles using gasoline, diesel, biodiesel, alcohol, natural gas, electric, and hybrid electric powertrains. He and his wife live in a beyond net zero house, and haven’t bought gas since 2019.
Sources: