


By Paul Stackhouse, Falguni Patadia and Zoe Waring June 17, 2024
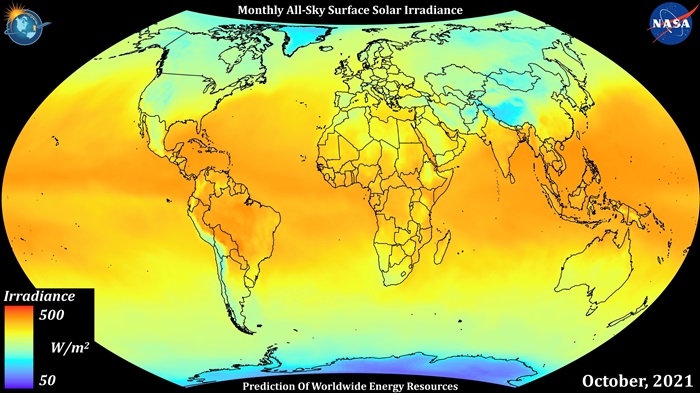
POWER's public ArcGIS Image services provide global coverage. The multidimensional Monthly Radiation image layer is registered with Esri's Living Atlas of the World, offering seamless integration into any workflow. (Credit: Christopher Higham, NASA POWER Development Team)
When people think of the National Aeronautics and Space Administration (NASA) they think of Mars, the moon, and what lies in the stars, but NASA also turns that scope back on Earth to better understand the planet we inhabit. NASA focuses on the large, the small and everything in between.1
Through the Prediction Of Worldwide Energy Resources (POWER) Project, NASA can provide environmental information to a global audience. According to its website, the project “provides solar and meteorological data sets from NASA research for support of renewable energy, building energy efficiency and agricultural needs.”
Data to Target Sustainability Goals
POWER is a cornerstone project in the Earth Sciences Division at NASA, whose mission is to help further the public’s understanding of the Earth and its processes. The project supports three main fields with its data products: Renewable Energy, Sustainable Infrastructure and Agroclimatology.
We currently provide data parameters from the Clouds and the Earth’s Radiant Energy System (CERES) mission for solar irradiance, the amount of solar radiation obtained per unit area. Our climate and meteorology parameters are from the Modern-Era Retrospective analysis for Research and Applications, Version 2 (MERRA-2) data products.
The surface solar radiation data dates back to 1984 and the meteorology data to 1981, which allows an expansive historical timeline for users to not only reference the current climate but to see how it has changed in the last few decades.
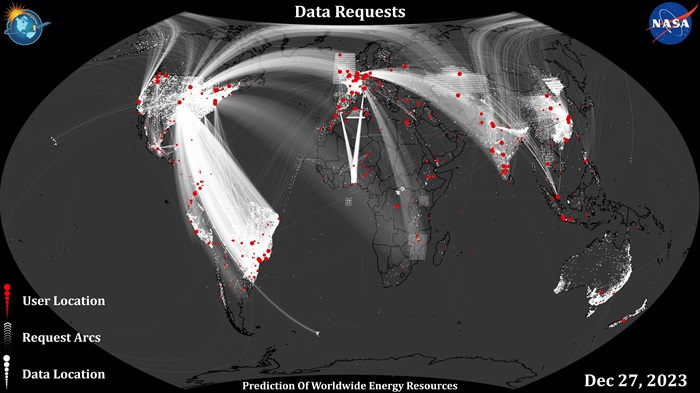
In POWER’s 26 years of providing Analysis-Ready Data, we have fulfilled over 480 million data requests. Every month POWER satisfies more than 10 million data requests for over 30,000 unique users for their various needs.
Users have leveraged POWER data for help on a range of solar projects such as optimizing solar site selection, maximizing battery storage for solar-energy systems, and understanding how the sun’s light affects nearby objects when it reflects off buildings.
A lot of data providers offer you a bucket of water when all you need is a glass. We allow a user to request the parameters relevant to their project instead of the entire data catalog. With POWER, users can pick the parameters that suit their needs. So, if solar-irradiance and cloud-cover data is all you need, you won’t have to sift through precipitation and humidity data as well.
For our users to benefit from features like this, we have developed easy-to-access tools and web applications. These tools are especially helpful for people and communities with limited software-development knowledge.
POWER’s Data Access Viewer (DAV) is a web-based application that requires little or no coding experience. It provides interactive mapping systems with detailed charts, geospatial datasets (data about information related to locations on Earth), and visualization tools.2
The DAV contains a robust selection of solar-, meteorological- and cloud-related data parameters that are geared toward designing and evaluating renewable energy systems. Users can download the data in different formats and for select locations or small regions around the world.
Many industries and organizations have utilized the unique features within the POWER DAV to conduct research and accomplish goals. One example is the solar forecasting system at Arunai Engineering College in India. These researchers use various solar and meteorological parameters from the DAV to predict the generation of their small solar-power system on campus.
We have a global range of diverse users such as private commercial companies, government agencies and research institutions. The data products in POWER are available for even the most remote places in the world. This assists communities that have difficulty finding data such as surface meteorological data outside of the range of a weather station.
Another unique quality of POWER is the dedication to our user community. It is a user-centric project that values the input from people using its data. We encourage our community to openly communicate with us through email, at events and through interviews so we can collect unique stories from every continent.
Whether it is solar-powered water pumps in Kenya, solar-generation forecasting in India, or solar-powered bus stops across North America, POWER is constantly engaging on many topics with communities. Below is a more detailed example of how POWER plays an instrumental role as a data provider to the renewable energy community.
Education with Solar Power
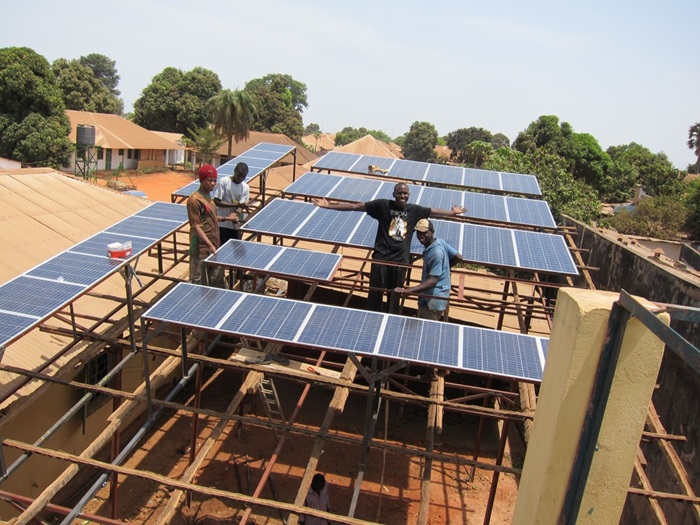
One of POWER’s users is SIL International, a global nonprofit. It specializes in providing language solutions in literacy, education, development and linguistics to communities. The goal of its Field Systems Department is to help power solar off-grid systems for language education and translations.
This department uses POWER data products to optimize its expenses during solar installation.
“[POWER] helps the bottom line of budgets. Essentially, it helps us install more systems because we are not needlessly putting solar panels or equipment out there that doesn’t need to be used,” said Jeremy Maller, a team manager at SIL International.
SIL International developed a public web-based Solar Insolation Lookup Tool (SILT), a Google-enabled and browser-based tool. It allows the user to predict solar-energy output based on panel orientation for any location in the world. SILT uses NASA POWER’s Application Programming Interface, which provides access to the data.
The SIL International team strove to solve an issue of inconsistent power in the remote areas where they work and to minimize its impact.
Imagine working on a detailed project for the last few months and approaching a tight deadline. As soon as you are about to complete it, you take a moment to savor your accomplishment. Then your computer dies. Not only did it die, but you won’t be able to charge it for several days. This is a real issue for people who don’t have access to consistent power.
The SIL team strove to solve this problem for its projects by building in a feature that identifies how many Dead Days a month there are for a given system and location. A Dead Day is equal to four consecutive days when the solar panel output that is less than what is needed to meet the demands of the system.
The tool predicts monthly Dead Days based on historic data so users can manage their energy usage around them. This feature also allows users to adjust the load and panel array size to estimate and reduce the number of Dead Days.
SIL International has helped develop solar power systems across the world, averaging about three custom systems a year and 20 portable systems. The nonprofit is looking to the future and is planning for a project in Africa to provide solar power for a large office building. SIL International expects to use POWER data products to implement a solar off-grid system suited to the needs of this location.
This organization demonstrates how NASA POWER data can be adapted to develop new tools that directly impact small communities around the world.
Every off-grid solar system that SIL International developed has changed people’s lives by enabling education and developing language skills. We offered SIL International the base data to accomplish its mission and will continue to do so for future endeavors.
The need for sustainable and renewable energy solutions is only increasing as the climate continues to change and demand for alternatives to fossil fuels increases. POWER will continue to provide valuable and trusted data in solar and meteorology that is free and available globally to the public.
NASA’s understanding of the cosmos and the Earth around us continues to grow as data from the agency inspires change and ingenuity for the future.
Sources
About the Authors
Paul Stackhouse is a senior research scientist at the National Aeronautics and Space Administration (NASA) Langley Research Center and leads the Prediction Of Worldwide Energy Resources team. He completed his master’s degree and doctorate in Atmospheric Sciences at Colorado State University in 1989 and 1995 respectively. He is a member of the American Solar Energy Society.
Falguni Patadia is a research physical scientist at the NASA Langley Research Center and serves as the deputy project manager for the POWER project. He completed a doctorate in atmospheric sciences at The University of Alabama in 2010 and a master’s degree in physics from Devi Ahilya Vishwavidyalaya in 2000.
Zoe Waring is a scientific and technical writer/editor for the NASA POWER Project team. She earned her bachelor’s degree in scientific writing from the College of William & Mary. She uses her editorial and content-writing knowledge to support the project team in various capacities.