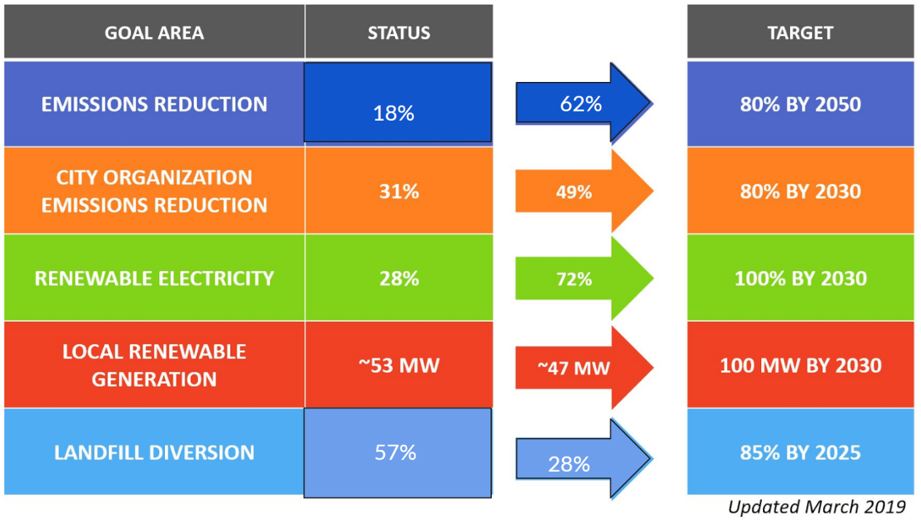
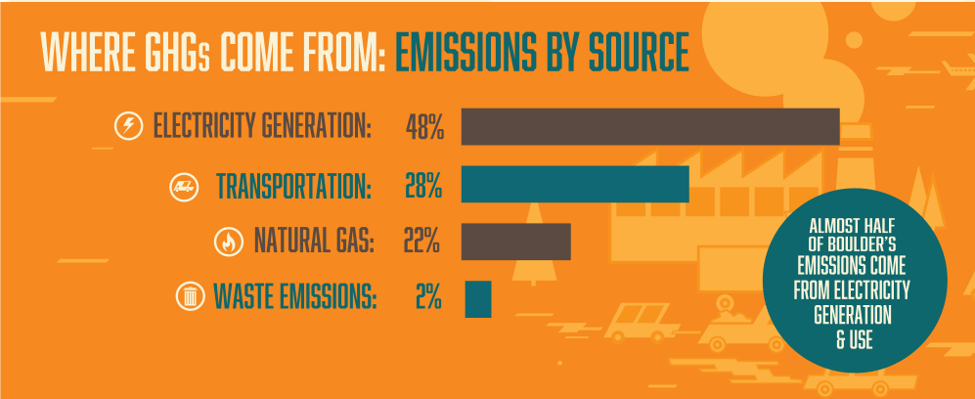
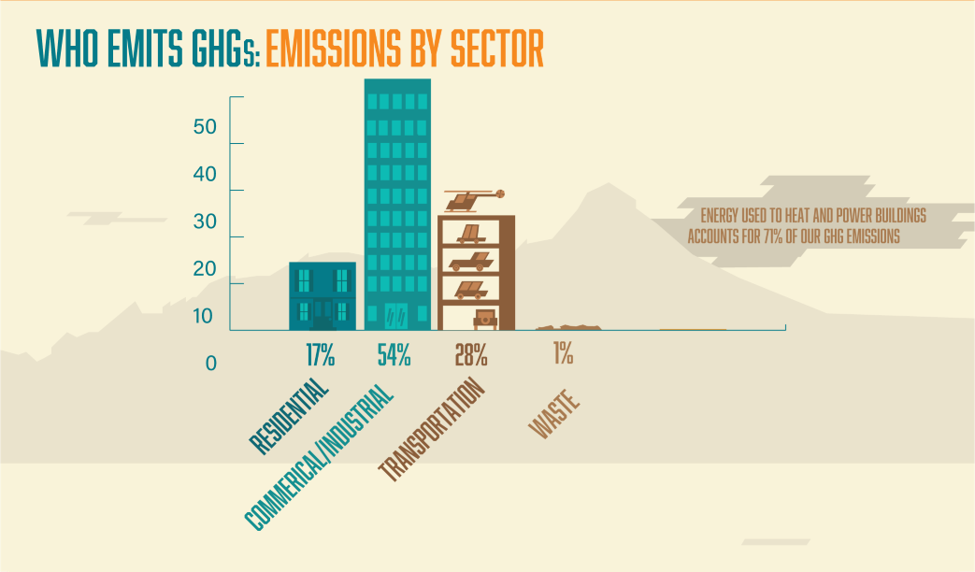
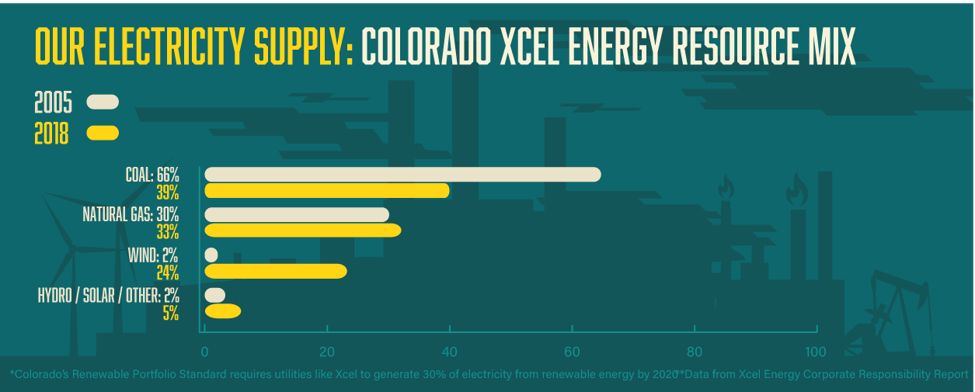
In this section, we will take a look at some different information and graphics that break down factors such as Boulders total energy usage, the main sources, the energy resource mix that provides power, and more.
*If it is not otherwise stated, all numbers are in the units of metric tons of carbon dioxide equivalent.
Climate Mobilization Action Plan
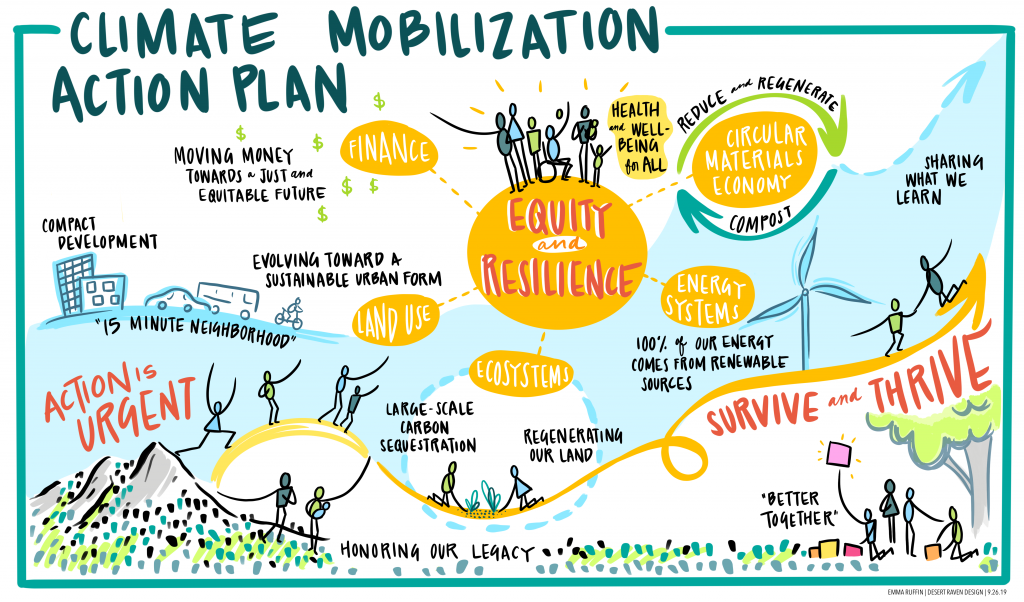
The Climate Mobilization Action Plan (CMAP) is the City of Boulder’s comprehensive, community-centered plan to take action on the global and the local climate crisis.
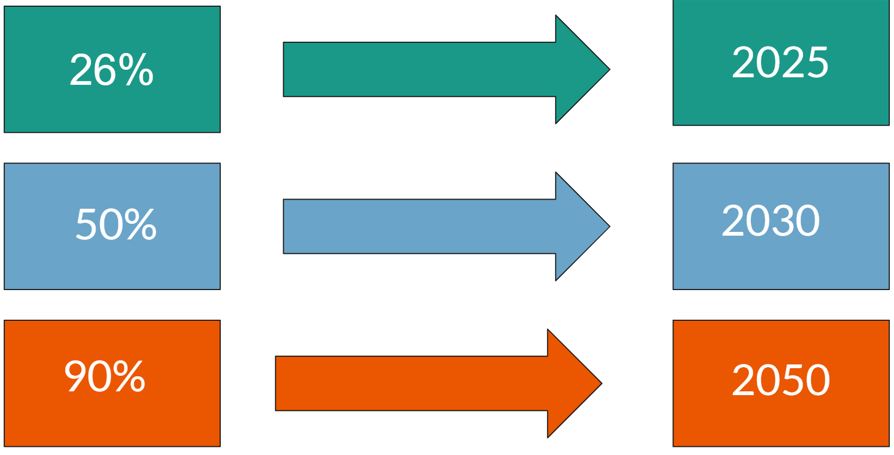
As this graphic highlights, CMAP shares ZEN’s value of creating a cleaner future through the efforts of an entire community. This graphic highlights some of the plan’s most important goals such as creating a 15 minute neighborhood, implementing large-scale carbon sequestration, regenerating our land, and more. The graphic also mentions some more ambitious long term goals, most notably for 100% of our energy to come from renewable sources. It is also important not to overlook CMAP’s final step, sharing what we learn. Boulder, Colorado is a progressive community with many of the resources necessary to become a role model for other cities to reduce their emissions. While we may be succeeding in fixing our own local climate crisis, the global crisis rages on and we should do all that we can to share what we have learned with other communities that are facing our same challenges. For more information about CMAP and what your local Boulder government is doing to fight the climate crisis, visit their web page here.
Energy Literacy
For those of you who want to learn more about Boulders energy grid, what “the grid” is, and more about energy, here is a helpful list of information:
Xcel Energy is one of many shareholders owned electrical utility companies. Alternatives to the standard shareholder option include cooperatives and municipalities.
“The grid” is made up of energy production facilities (coal burning plant, wind turbines, etc.), substations which provide regulation, and transmission lines that distribute power.
Energy is measured in Watts. Watts can be thought of as energy over time. 1000 Watts per hour is known as a kilowatt-hours (kWh). 1 kWh is roughly equal to the amount of energy required to run an oven for 1 hour. In 2018, the average annual electricity consumption for a U.S. residential utility customer was 10,972 (kWh). The amount of energy that 1 solar panel can produce in a year is dependent on many variables. Local Boulder solar gardens get about 750 kWh a year per panel.
Fossil fuels are energy sources. They are nonrenewable on relevant time scales and emit greenhouse gasses. Coal is the dirtiest energy source and natural gas is the “cleanest”.
Renewable clean energy sources are renewable in production and do not emit greenhouse gasses. Wind works better for large scale operations. Solar works well in many forms.
Problems with 100% renewable grids are managing demand. Terms: Ercot/ Duck curve, Ramp
In a clean grid, demand can be managed through better storage and better-connected grids.
If you put solar panels on your house, you will be limited in the amount of energy that you can produce. You can only produce 130% of the energy you need. The extra energy you do produced can be net metered. This process monitors your generation of extra energy so that the utility provider can pay you back corresponding to the amount of energy you put into the grid.
If you cannot purchase solar for your home, you can buy Renewable Energy Certificates. Buying into these programs will mean your energy is coming from a renewable production site instead of a non-renewable production site.
When you buy a REC, you will receive a bill credit on your energy bill. A bill credit is dollar savings that correspond to the amount of energy your REC produces.